Proactive Decision Support
Visualizing complex planning and coordination to increase planning efficiency by 21%

Background
In order to have successful missions, the US Coastguard needs a centralized planning tool to capture all communication across stakeholders.
Note: This project is under strict NDA and For Official Use Only, so I will be sharing limited deliverables and content for this project.
Problem
The US Coast Guard has a lot of resources to manage to ensure prompt arrival upon various countries for events. Planning for such events requires careful coordination among members of large, distributed teams. Currently, the Coast Guard relies on multiple information sources causing fragmentation, leading to suboptimal decisions for planning.
Solution
Design and deliver a centralized navigation planning tool to facilitate all operational navigation planning to prevent the US Coast Guard from having to shift between multiple information sources. This will ensure situational context is retained as the US Coast Guard can navigate within a single planning tool.
Impact
APPROX.
21%
planning efficiency
APPROX.
720
hours of labor saved annually
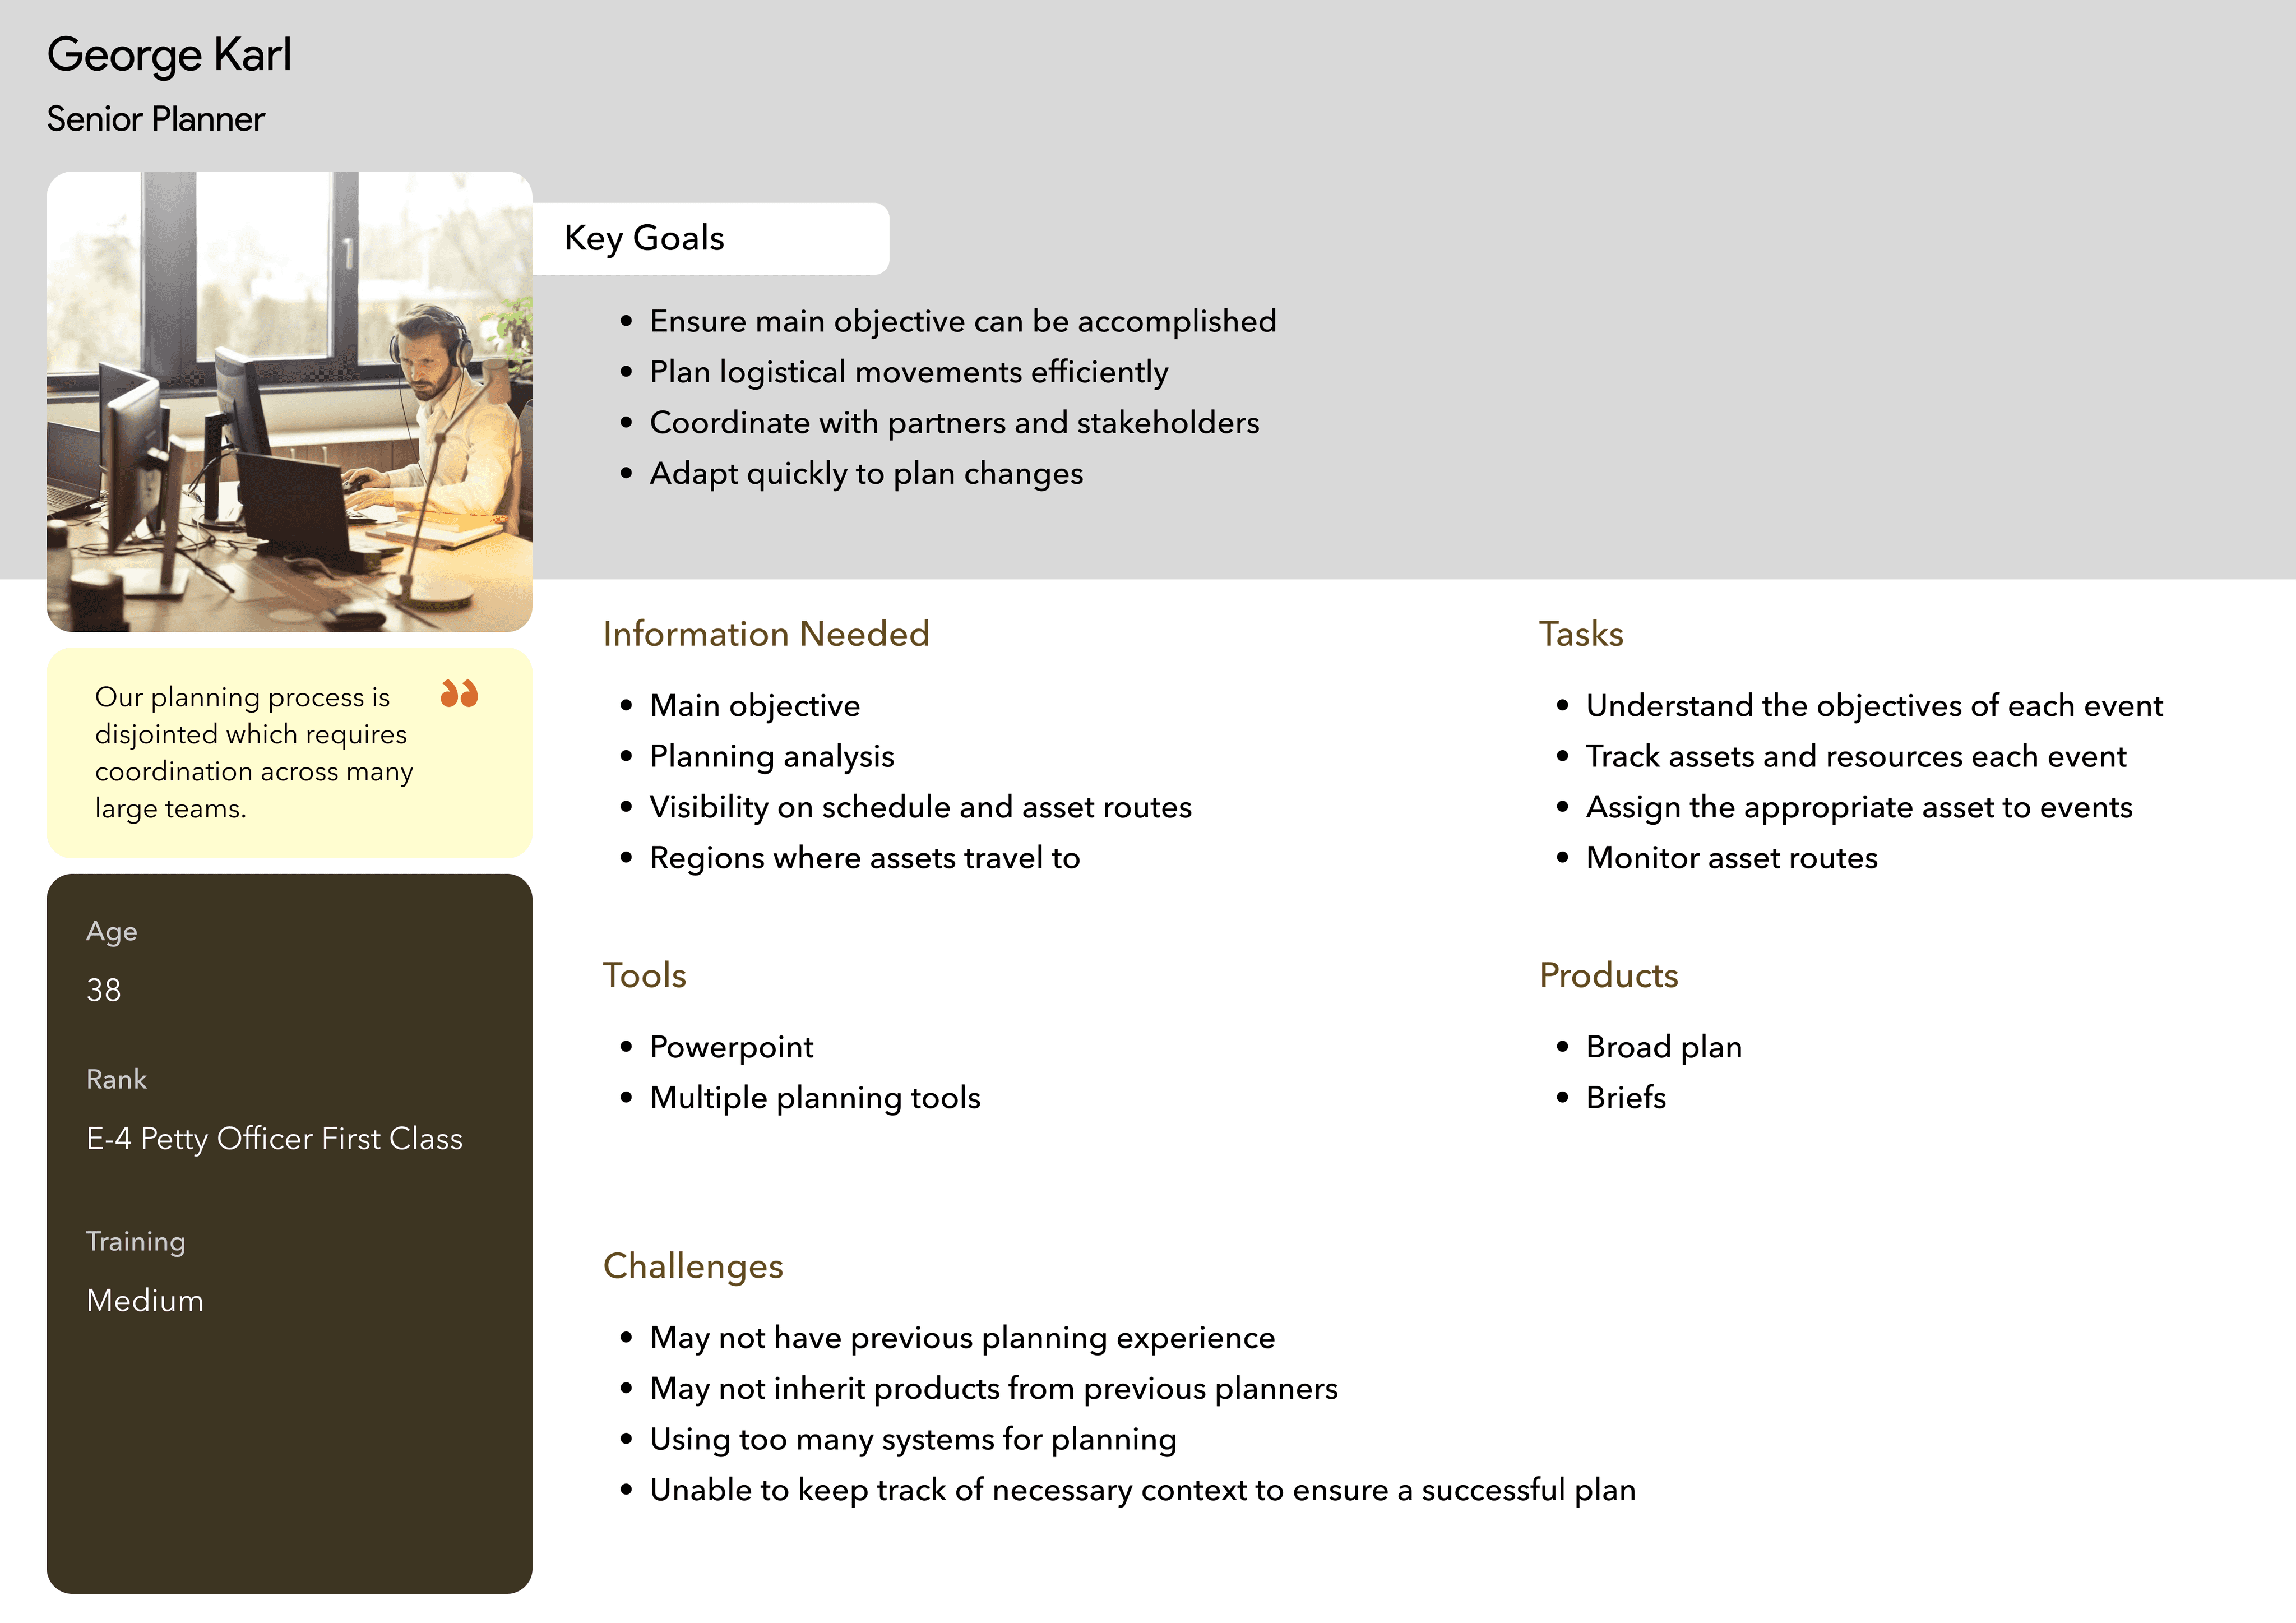
User Personas
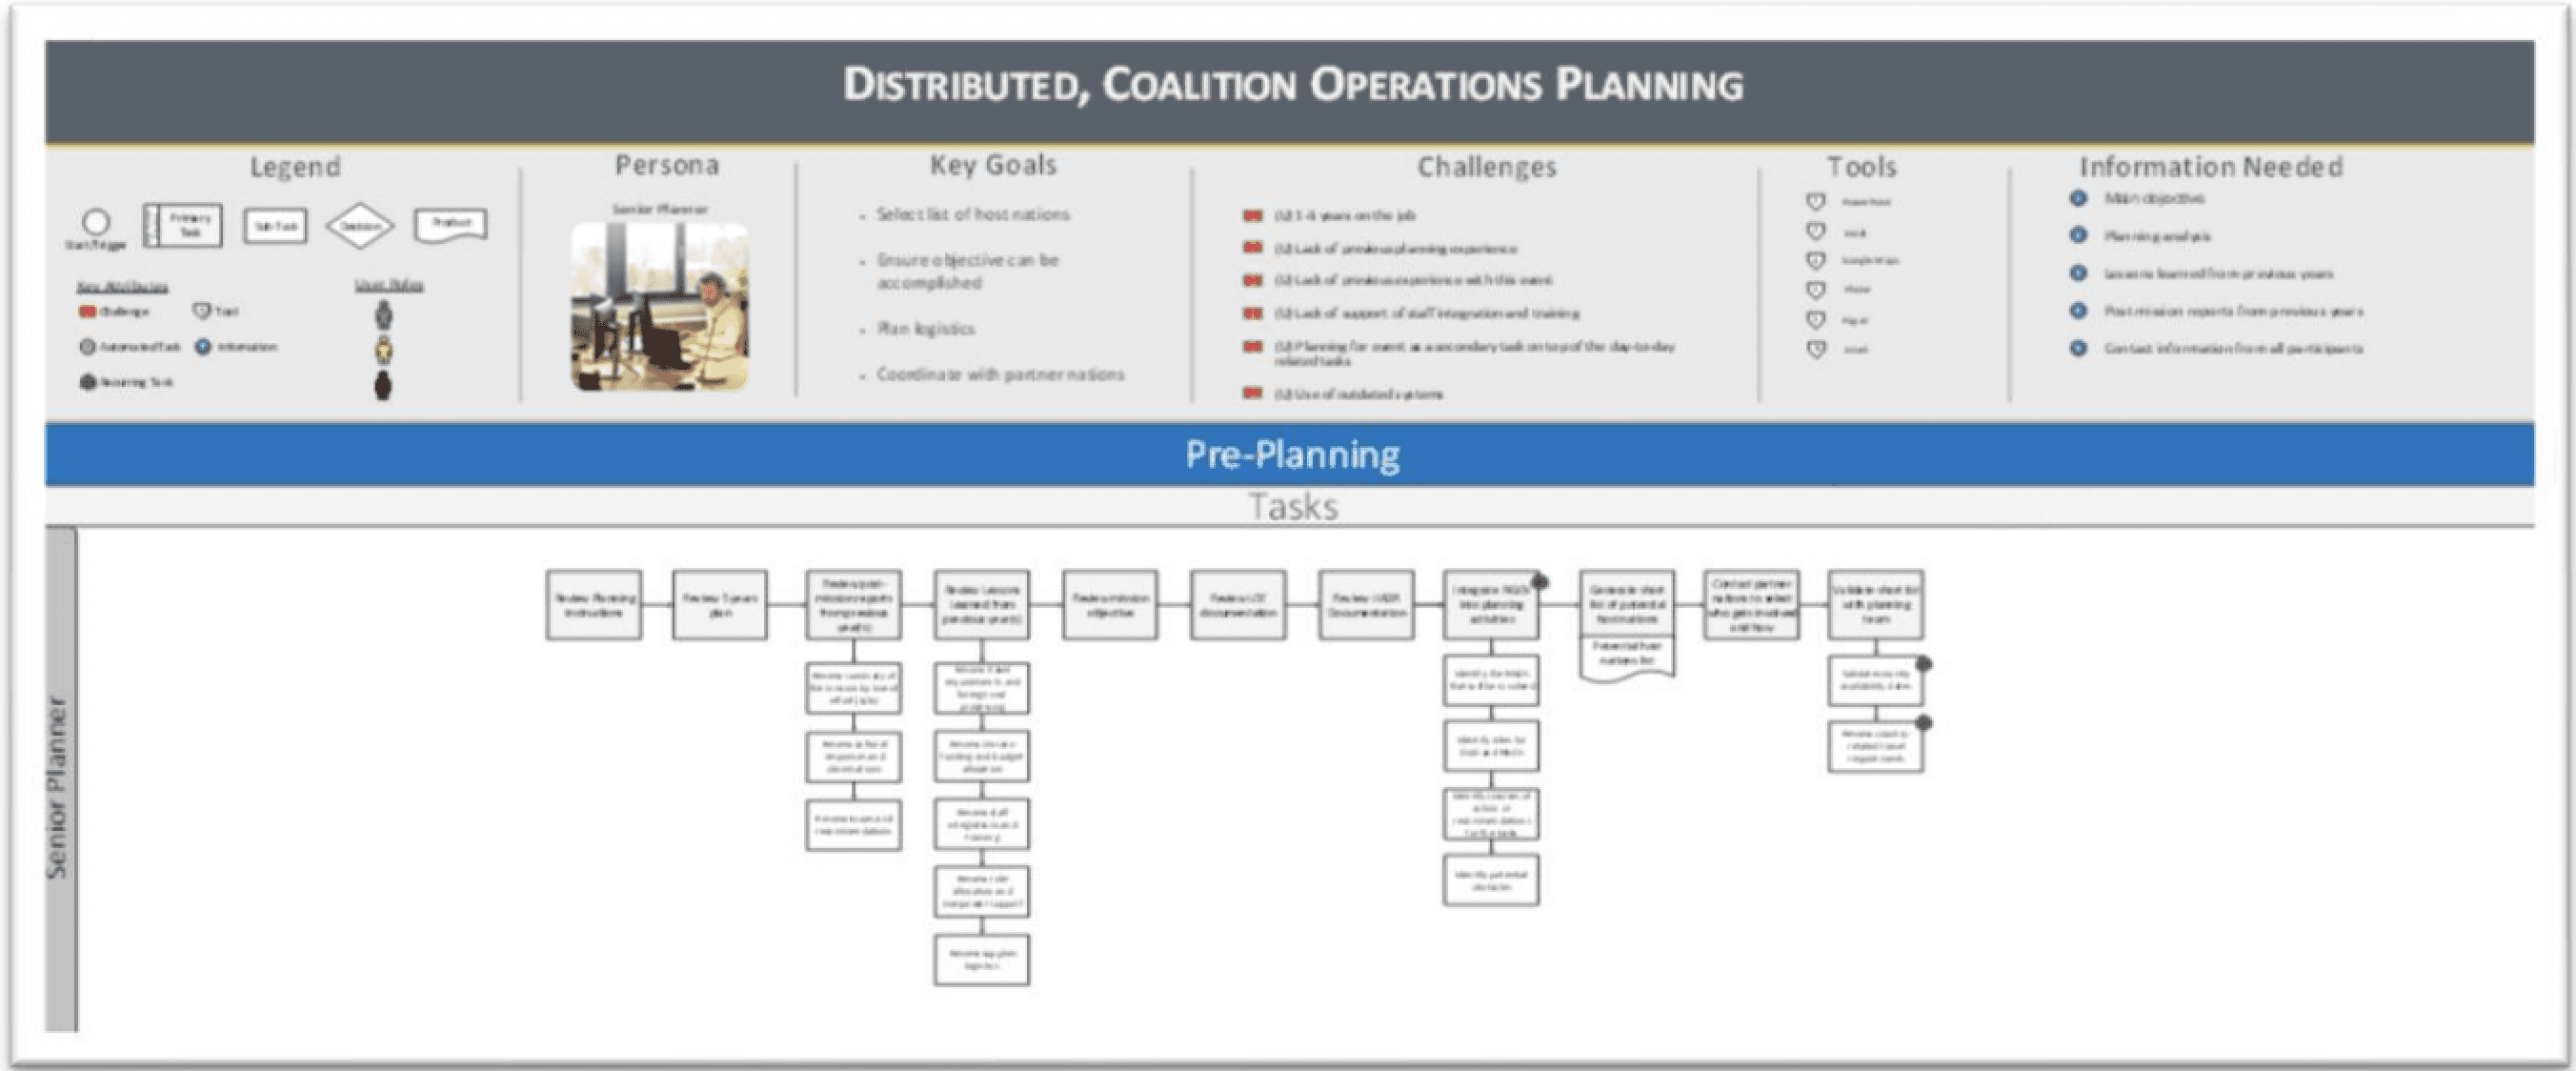
User Flow
After conducting user interviews with the Coastguard to get a better idea of their workflow and use journey for planning Coastguard operations, I devised the following workflow:
Prototyping & Testing
Here are some iterations of the design through continuous testing and user feedback:
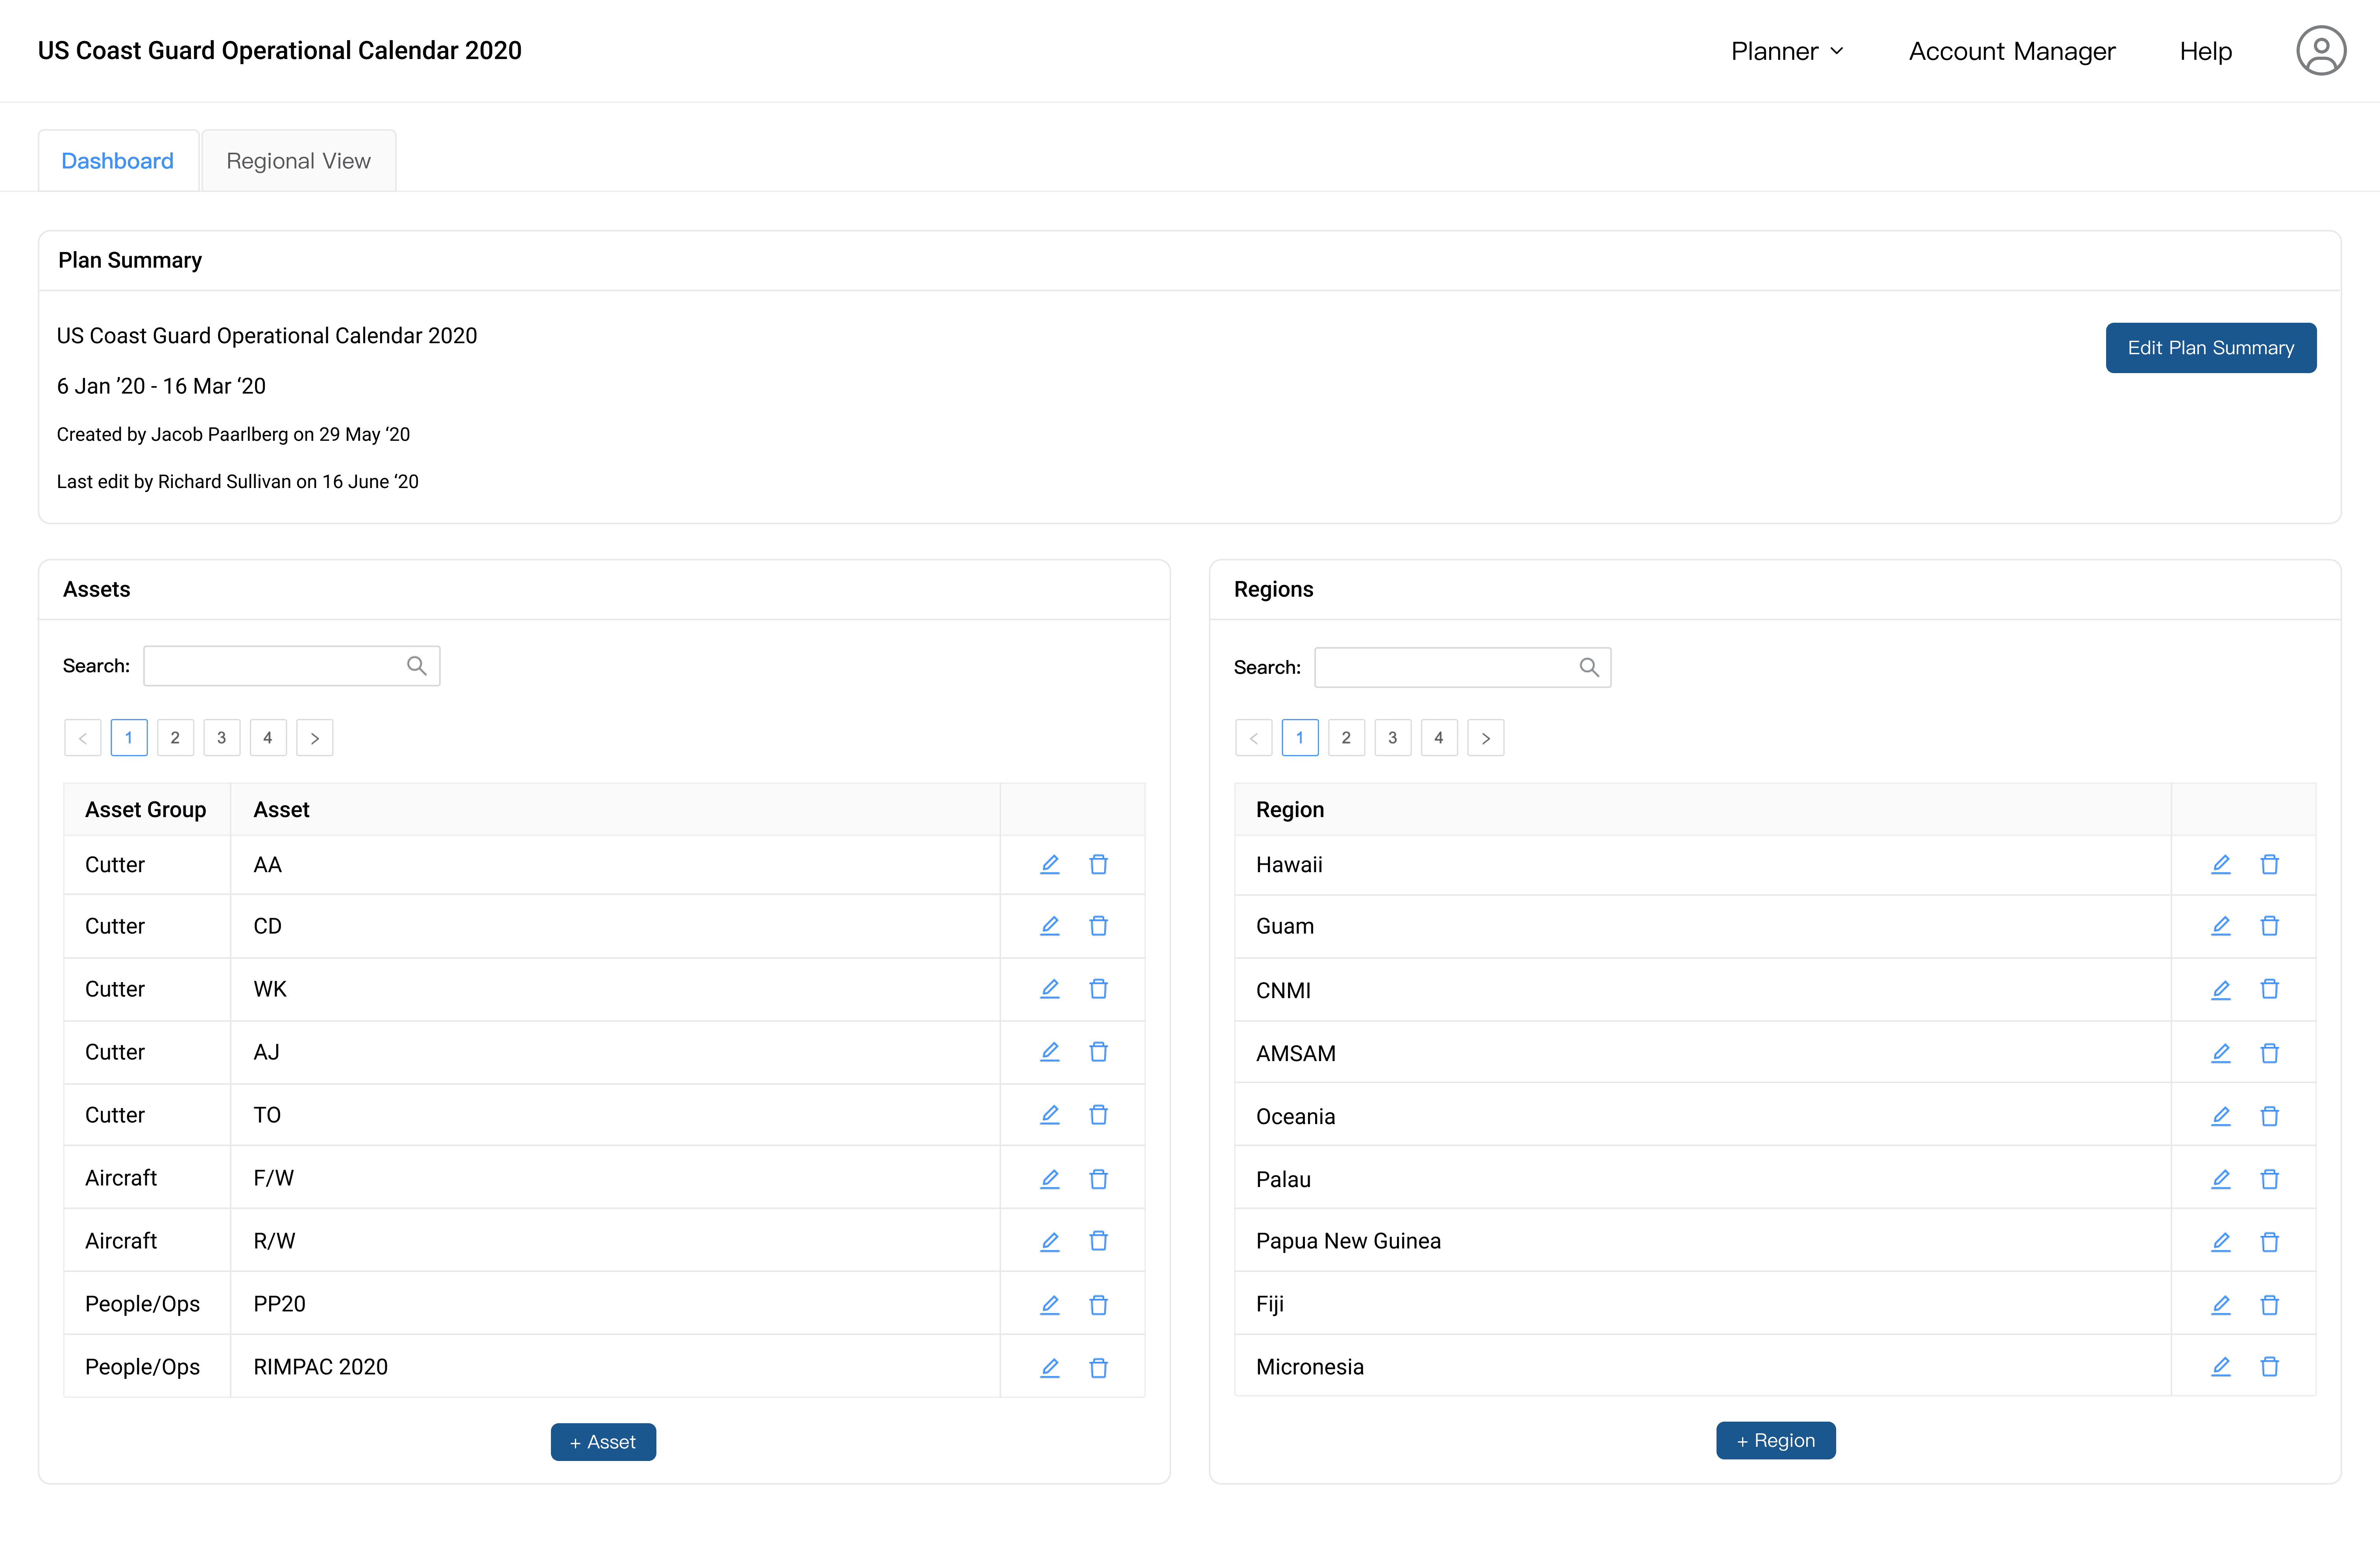
We found that Coastguard users wanted the ability to add Assets (e.g., cutters, aircrafts, people/operations) so there would be a prepared list to select from when the asset needed to be utilized in the plan.

Then, we learned that there are a lot of different types of statuses for assets, hence why we added the ability for users to create and define a legend.
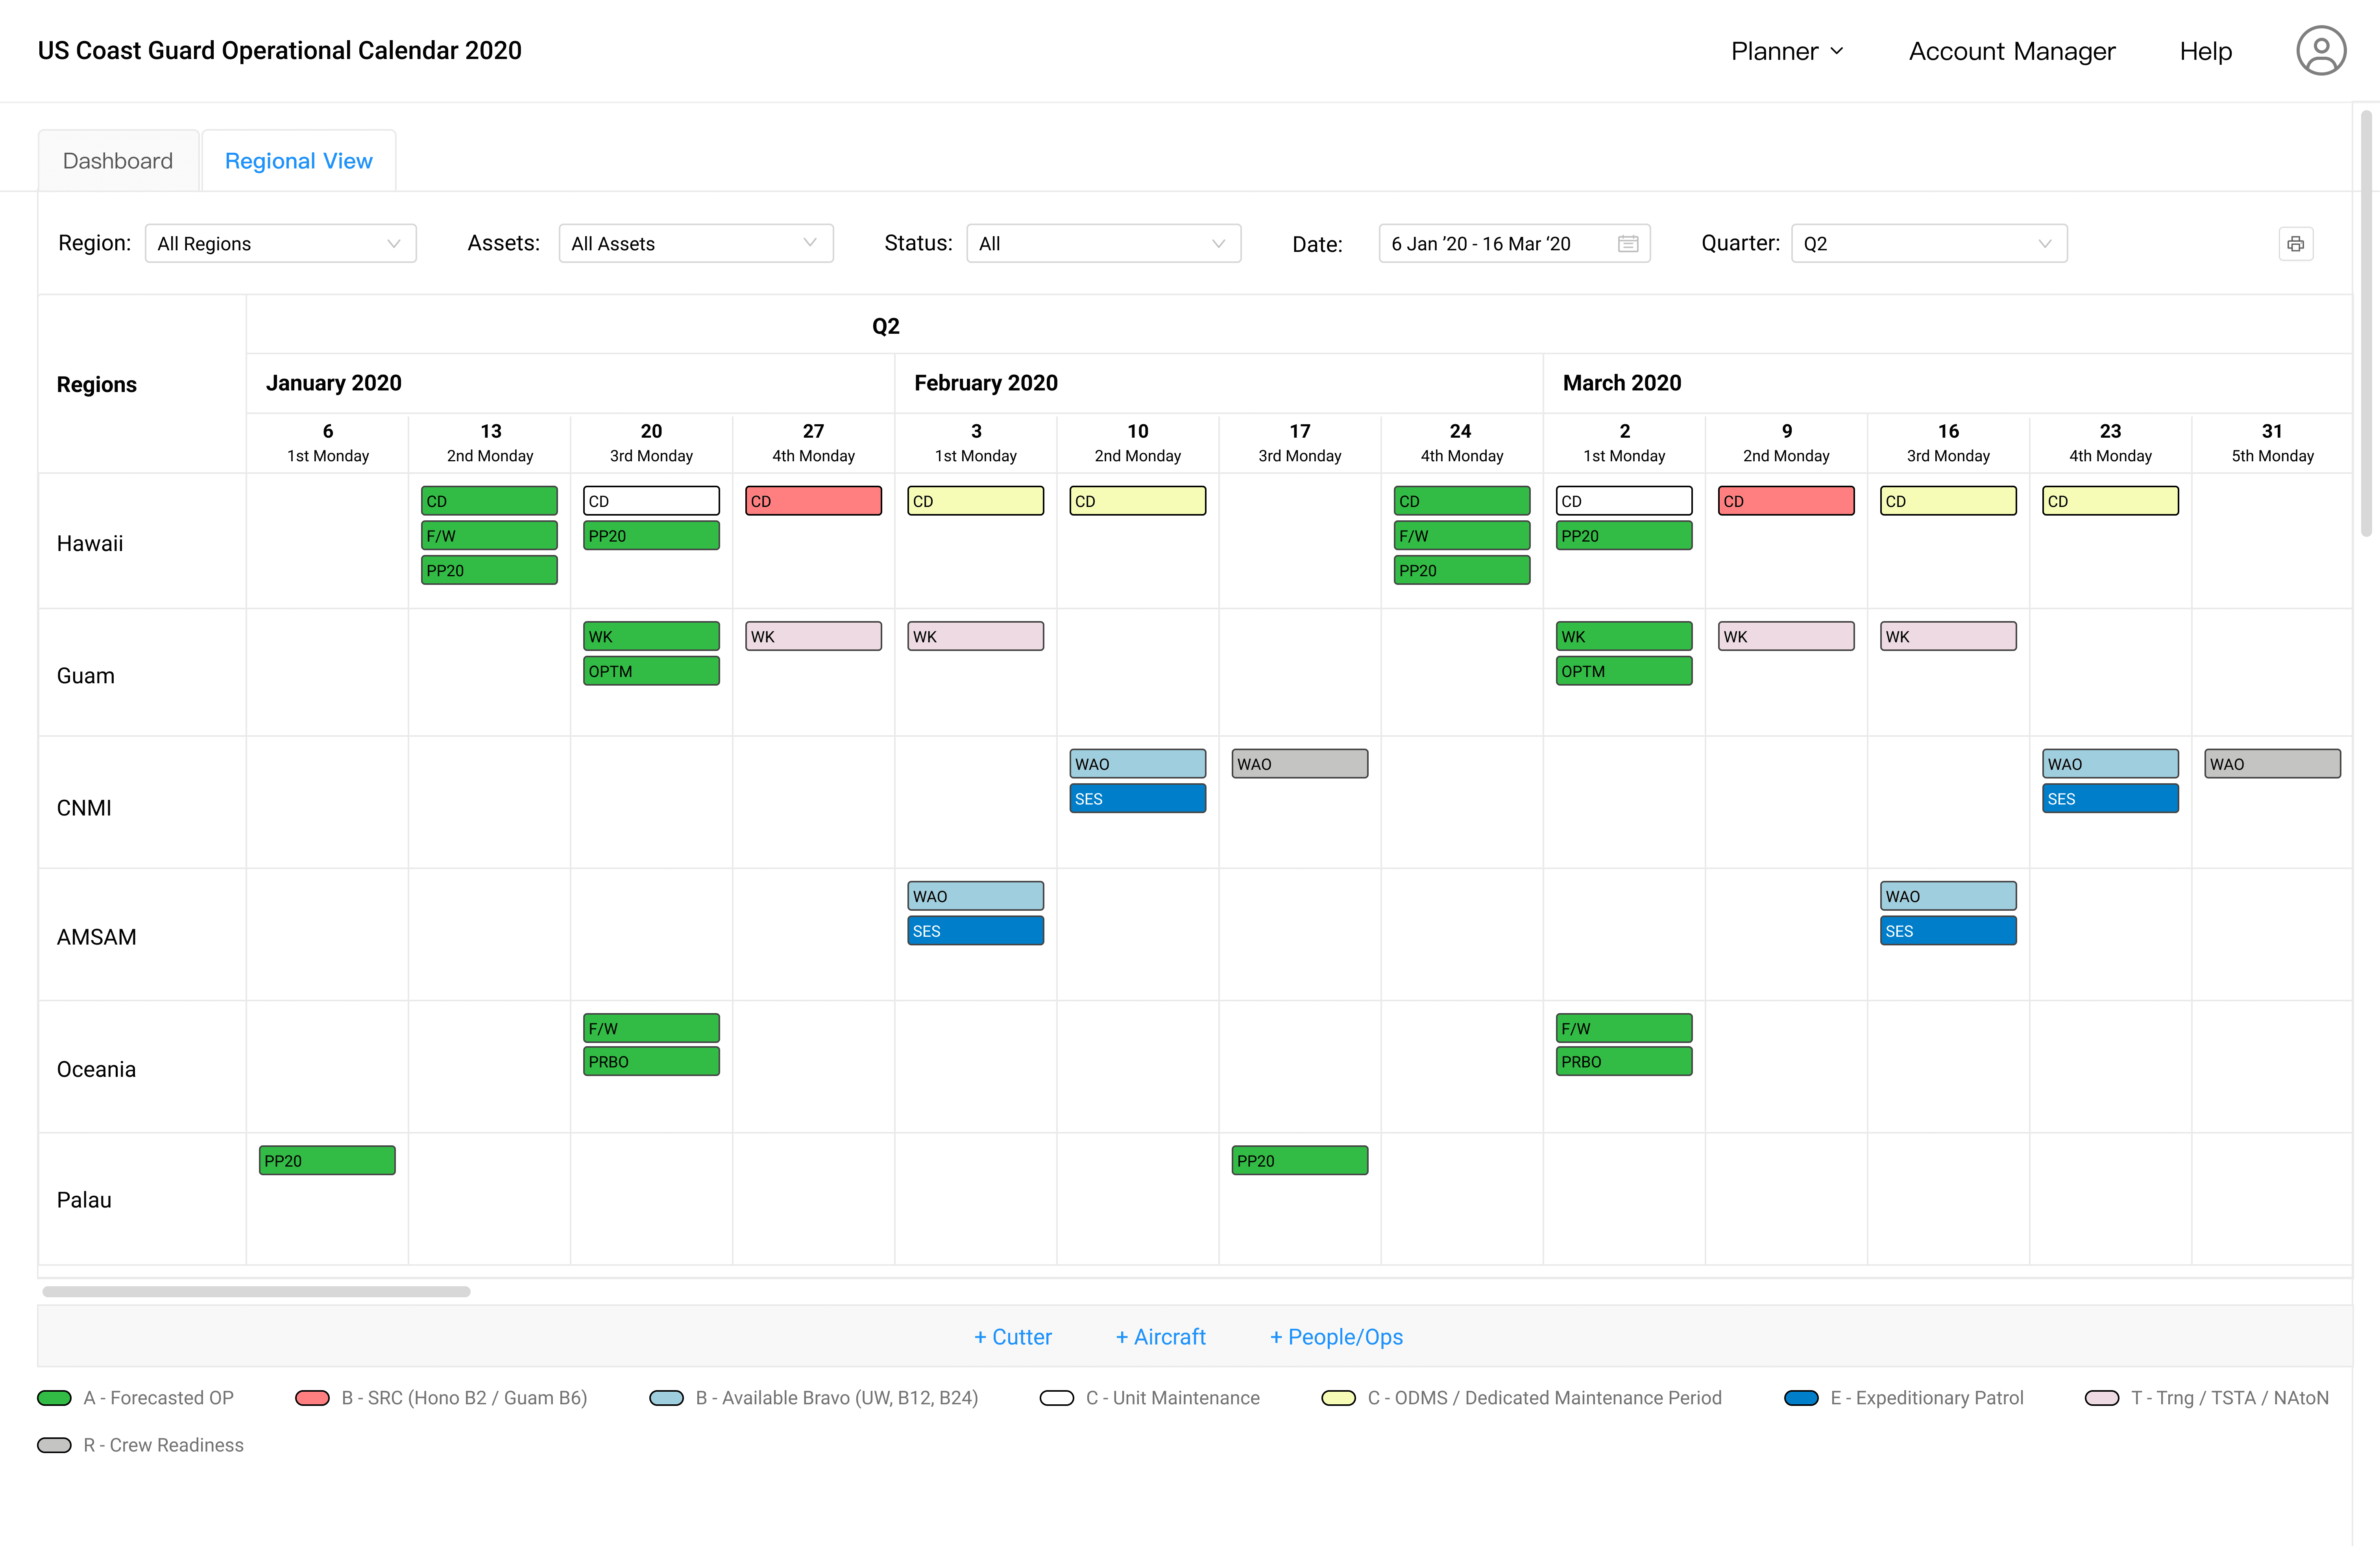
We created the regional view of the plan to show which assets were in which region across time and found that they wanted the plan to display by quarter.

Through additional feedback, we found the user needed filters for:
TACON (tactical use and assignment)
time zone / date - filter by UTC time zone (regions filtered by their time zone to holistically see events happening in order) or by date.

The Coastguard team also wanted a view based on Assets to have a simple view of the status and assignments for each asset across time.
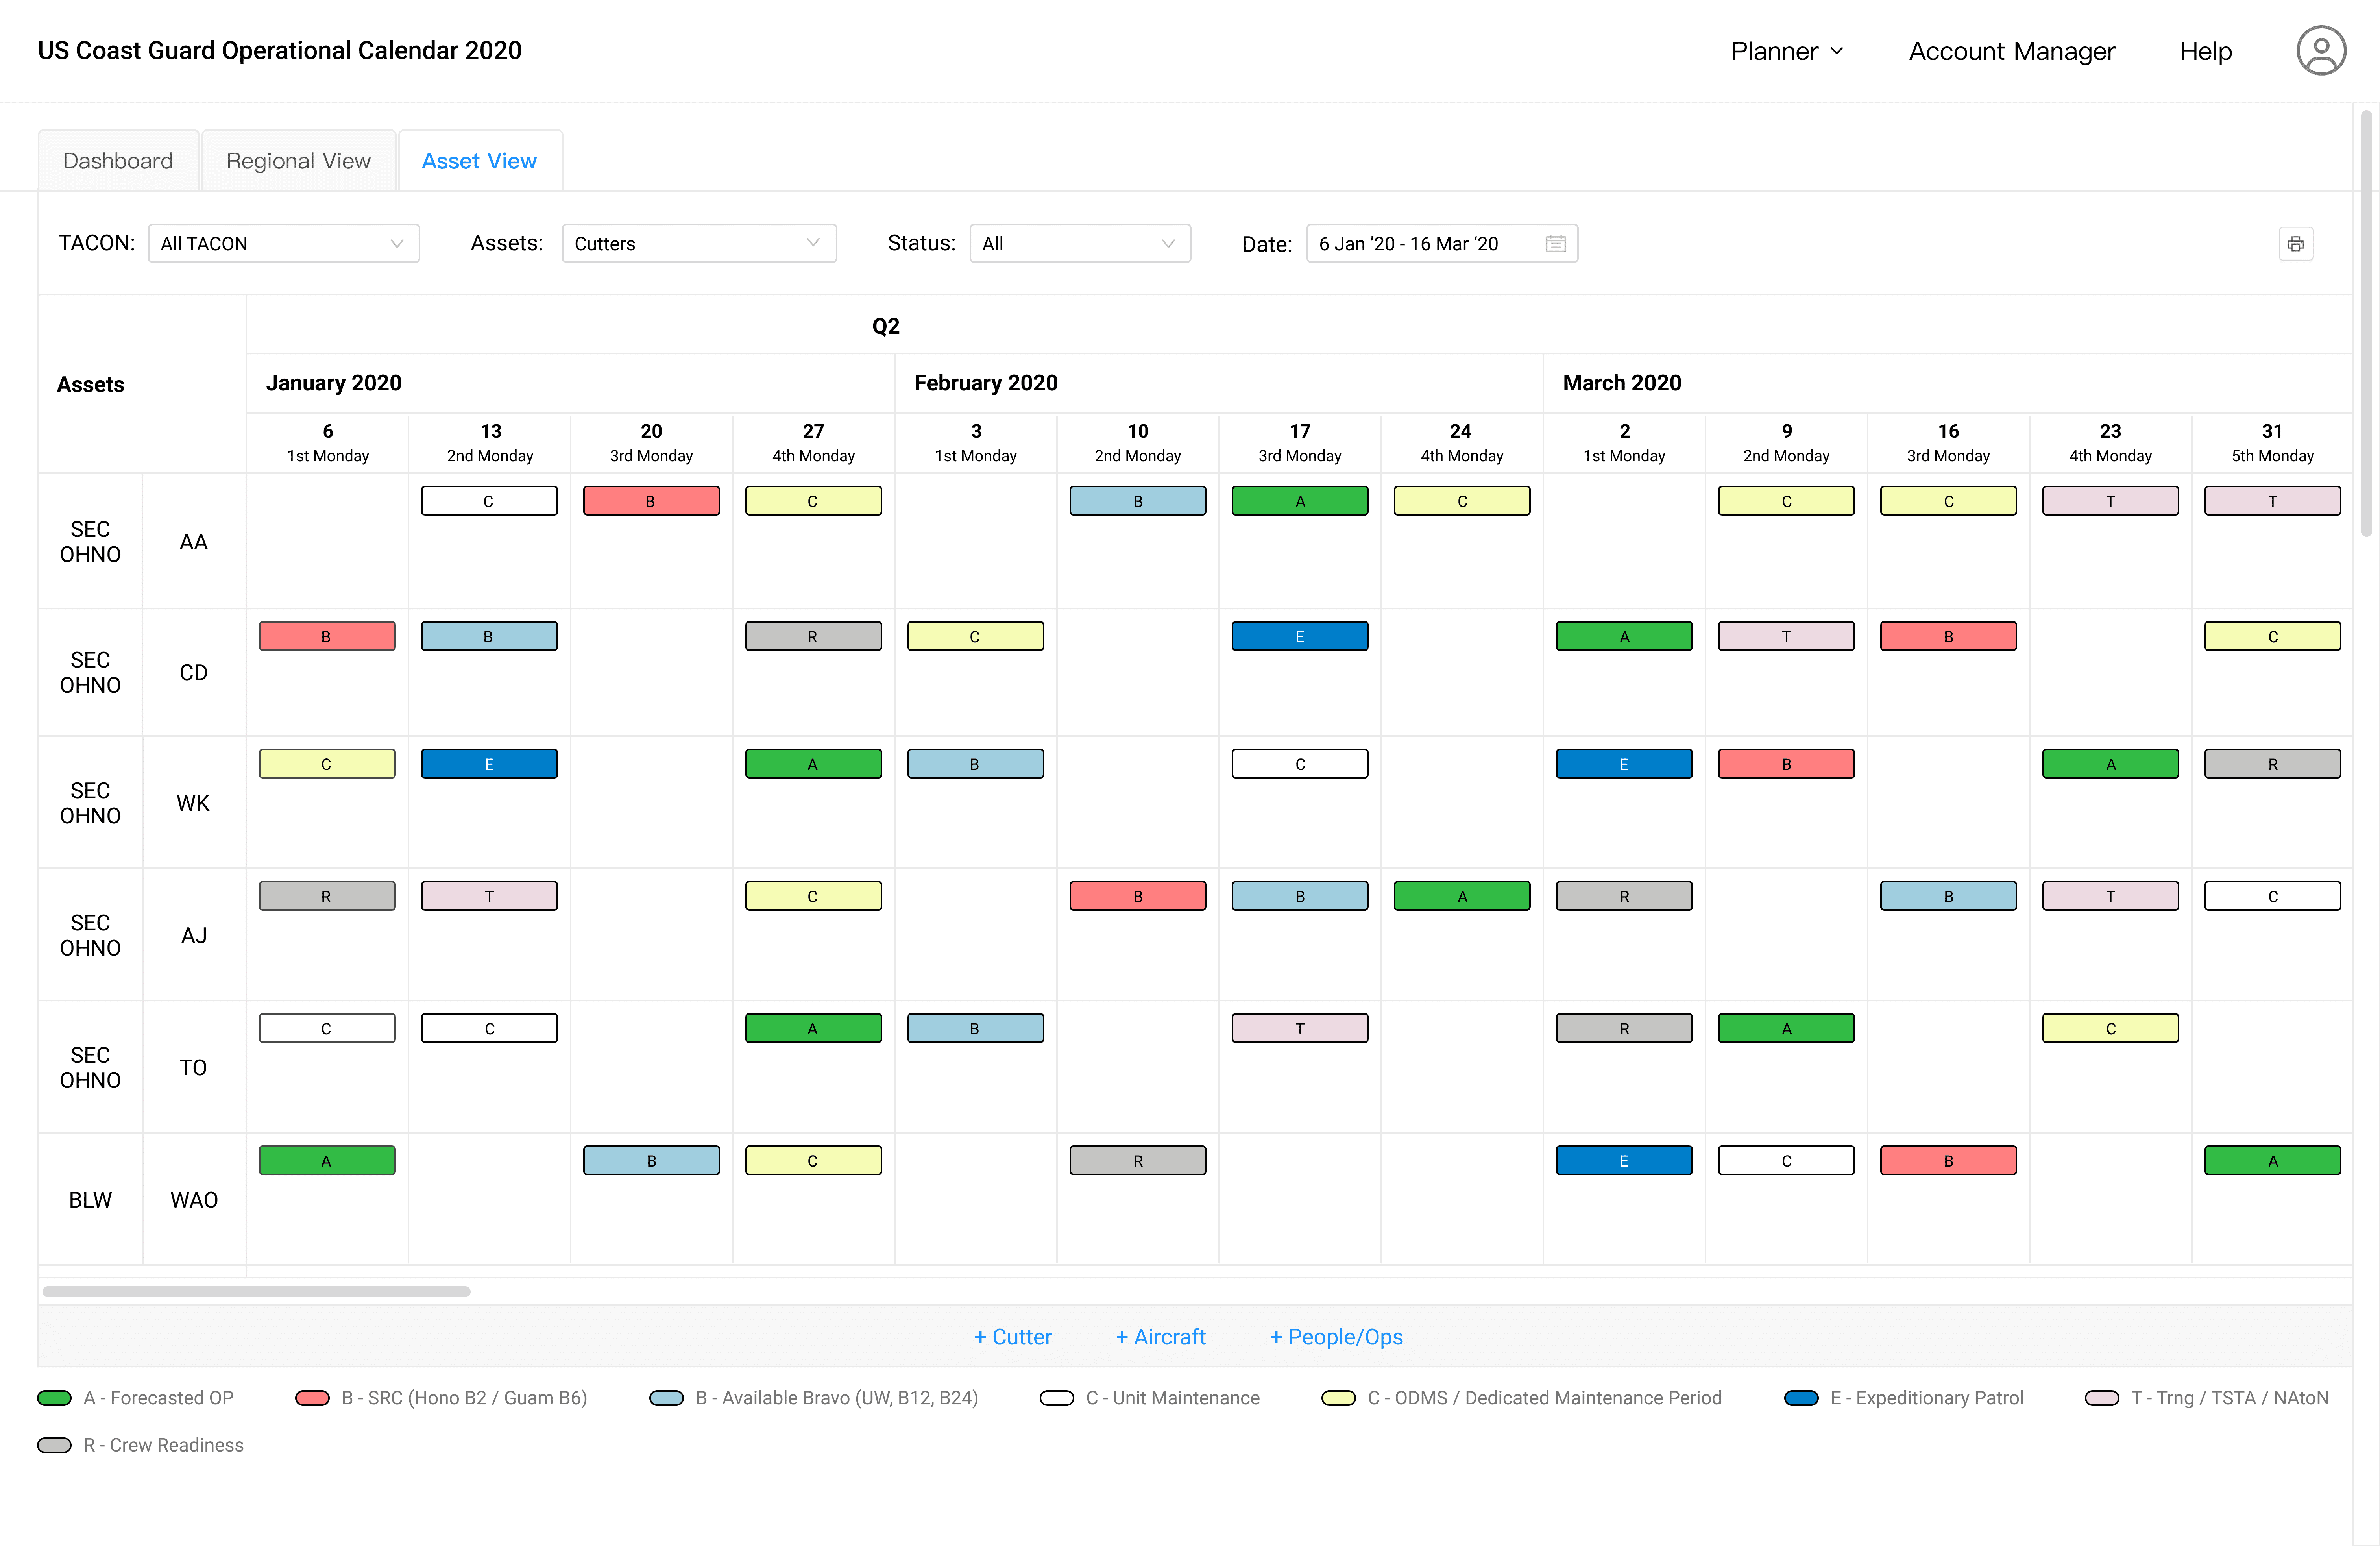
The next iteration, includes the sector of each asset as users needed the additional context of the asset's sector.
UI Design - Map Feature
Map for Exclusive Economic Zones (EEZ)
After handling the core needs of the Regional View and Asset View, the Coast Guard mentioned their strong need to be able to view Exclusive Economic Zones (EEZ).
Initial Strategy: I split the Map into two distinct views—Coverage and Asset Route—mirroring the existing Planner views: Regional View and Asset View. This design decision was made to reduce cognitive load and provide a clearer, more focused user experience by separating the two contexts.

Coverage View
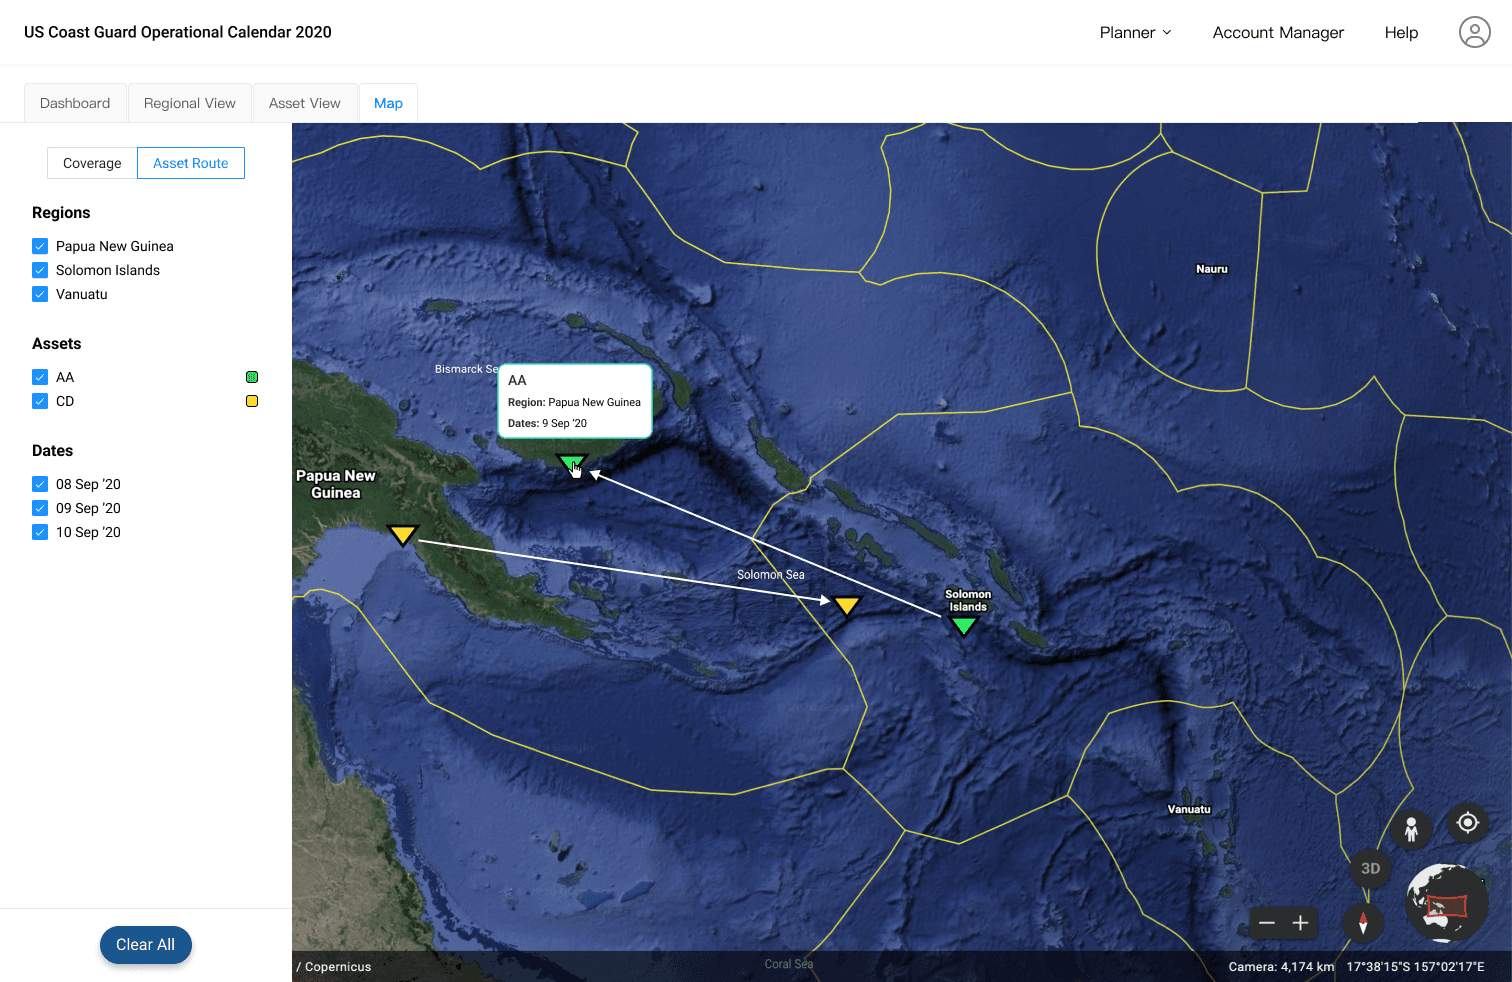
Asset Route View
However, I also conducted user testing with the design shown below to evaluate how users responded to a combined view of the Coverage and Asset Route.

Combined View
Insights
I learned that combining both the 'Coverage View' and 'Asset Route' view was not overwhelming the user.
Actually, it proved to be more helpful, because users conveyed that seeing both the operation and the assets at the same time provided the additional context for the assignment of the asset in specific EEZ zones.
The US Coastguard was able to identify if an asset was running late for an operation.
Results
21% increase in planning efficiency by spending approximately 720 fewer hours on planning efforts compared to previous years.
• Reducing conflict in booking assets
• Prevented overbooking of the maintenance schedule for assets due to limited availability of maintenance slots
• Reducing amount of back and forth communication and coordination across the US Coast Guard
Lessons Learned
The value is in the details and really understanding the technical context of your users.
Don't blindly follow heuristics, heuristics are context dependent.
There are many ways to visualize information; it is very crucial to understand what the key data points are and their hierarchy of importance.